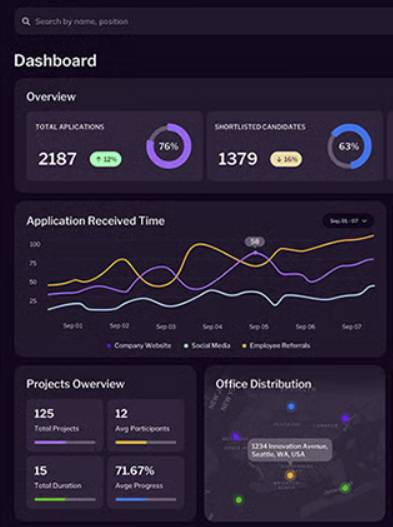
Replace manual spreadsheets with pre-built dashboards, custom report builders, and AI-powered forecasts. Make data-driven decisions that boost occupancy, control labor costs, and minimize turnover.
Siloed spreadsheets and manual exports make strategic analysis a multi-day chore.
No real-time visibility into labor and occupancy metrics.
Fragmented data prevents cross-functional insight.
Manual reporting is error-prone and outdated.
A comprehensive reporting hub that unifies all hotel data, HR, operations, maintenance into real-time dashboards, custom reports, and AI-driven forecasts.
Pre-Built Hospitality Dashboards
Staffing & Labor Efficiency
See labor cost as a percentage of revenue, average hours per department, and overtime trends updated live.
Occupancy & Revenue Overview
View daily, weekly, and monthly occupancy rates alongside average daily rate (ADR) and RevPAR, all in a single chart.
Maintenance & Asset Health
Monitor number of open repair tickets, average time to repair, and asset downtime, spotting problem areas quickly.
Custom Report Builder
Drag-and-drop interface
Select fields (e.g., “Hire Date,” “Last Review Score,” “Total Hours Worked,” “Maintenance Cost”) and apply filters (“Housekeeping,” “Full-Time,” “June 2025”) to create your own report—no SQL required.
Scheduled exports & email delivery
Configure monthly budget vs. actual reports to auto-generate and email to stakeholders every first business day—no manual follow-up.
Cross-module joins
Combine recruiting, scheduling, and maintenance data in a single query—e.g., correlate “Time from hire to first cleaning assignment” with “Room readiness scores” to see onboarding effectiveness.
AI-Powered Predictive Analytics
Turnover Risk Predictions
AI analyzes factors (tenure, performance ratings, scheduled shifts) to flag employees at high risk of leaving—enabling proactive retention efforts.
Overtime Forecasting
Based on upcoming reservations and historical staffing trends, AI highlights which departments will likely incur overtime next week—so managers can hire part-timers in advance.
Revenue Impact Modeling
Simulate how raising room rates by 5 € during high-demand weekends affects occupancy and revenue—AI runs scenarios in seconds.
Role-Based Access & Visualization
Executive Overview
General Managers access a summary dashboard with KPIs at a glance—guard rail charts for budget, occupancy, and guest satisfaction.
Department Snapshots
Housekeeping managers see only their team’s efficiency and compliance metrics; HR managers see recruiting funnel, time-to-hire, and training completion rates.
Interactive chart drill-down
Click any data point (e.g., a spike in May labor cost) to drill into details—view which roles or events drove the increase.
Lorem ipsum dolor sit amet, consectetur adipiscing elit, sed do eiusmod tempor incididunt ut labore et dolore magna aliqua. Ut enim ad minim veniam, quis nostrud exercitation ullamco laboris nisi ut aliquip ex ea commodo consequat. Duis aute irure dolor in reprehenderit in voluptate velit esse cillum dolore eu fugiat nulla pariatur.
Selena White
Hotel Seinz
Save 80% of analysis time
by replacing manual exports with real-time dashboards.
Reduce turnover by 15%
through AI-driven risk alerts and targeted retention campaigns.
Lower labor costs by 10%
with proactive overtime forecasting and hiring.
Make informed decisions in minutes
using interactive data visualizations and scenario modeling.